Ask most teams how much pipeline their outbound will generate next quarter and you get a number that was set the same way the revenue target was set: top down, by someone who needed it to be a certain size. The board wants $4M in new pipeline, outbound is “responsible for a third,” so outbound owes $1.3M. Nobody can explain how the sending capacity, the list, and the conversion rates add up to that figure, because the figure was never built from those inputs. It was assigned.
That is not a forecast. It is a quota wearing a forecast’s clothes. A real forecast starts from the things you actually control and multiplies forward. When you build it bottoms-up, two useful things happen: you get a number you can defend line by line, and you find out early whether the target the business wants is even physically possible with the capacity you have. This is how to build that model.
Why top-down outbound targets fail quietly
A top-down target fails in a way that is hard to catch until the quarter is half over. Because it was never tied to inputs, there is no early signal that it is off. The team sends email, books some meetings, and only at the midpoint does the gap between “meetings booked” and “meetings implied by the target” become undeniable. By then two months of sending capacity are gone and there is no way to make them up.
The bottoms-up model surfaces the same problem in week one. If your capacity and conversion rates cannot mathematically produce the target, you know that before you send a single sequence, and you can have the conversation about capacity or expectations while there is still time to act on it.
The five inputs every outbound forecast rests on
Strip an outbound motion down and there are exactly five numbers that determine how much pipeline it produces. Everything else is commentary.
- Sending capacity. How many net-new contacts you can email per month without wrecking deliverability. This is a function of how many domains and inboxes you run and how many sends each can safely carry. It is a hard ceiling, not an aspiration.
- Deliverability rate. The share of those sends that actually land in a primary inbox. An email in spam or Promotions converts at zero, so this multiplier sits at the front of the model and quietly caps everything after it.
- Reply rate. Of the emails that land, the share that get any human response. Positive and negative replies both count here; you separate them in the next step.
- Positive reply to meeting rate. Of the replies worth having, the share that convert into a booked meeting.
- Meeting to opportunity rate. Of the meetings held, the share that become qualified pipeline your AEs will actually work.
Multiply them in sequence and you have a forecast. The discipline is refusing to guess any of the five. Each one should come from your own historical data, and where you have no history, from a conservative benchmark you label clearly as an assumption.
Working the model forward
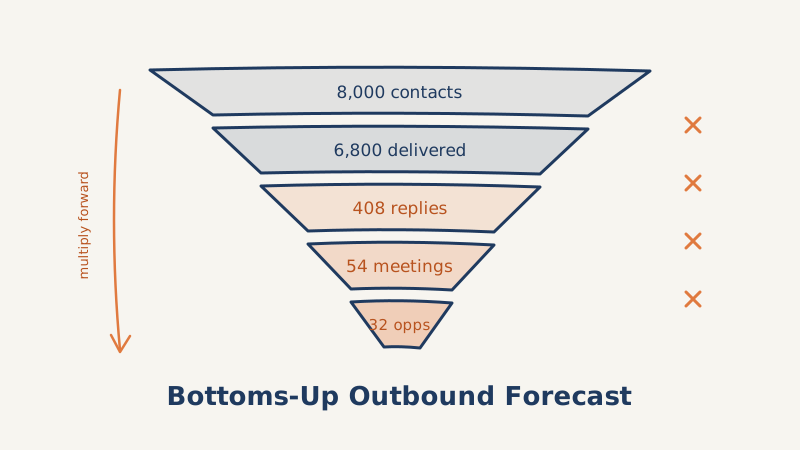
Take a concrete example. Say you run enough domains and inboxes to safely send to 8,000 net-new contacts a month. Your deliverability, measured on a seed list rather than assumed, is running at 85 percent. Your reply rate is 6 percent, a third of those replies are positive, and 40 percent of positive replies turn into a booked meeting. Historically 60 percent of meetings held become qualified opportunities.
Walk it through:
- 8,000 contacts sent
- times 85 percent delivered = 6,800 landed in inbox
- times 6 percent reply rate = 408 replies
- times 33 percent positive = 135 positive replies
- times 40 percent to meeting = 54 meetings booked
- times 60 percent to opportunity = 32 qualified opportunities
Multiply 32 opportunities by your average deal size and you have a monthly pipeline number that is not a wish. It is the arithmetic of your actual capacity and your actual conversion rates. Quarter that out, adjust for ramp, and you have a forecast you can put in front of a board and defend every line of.
Deliverability is the multiplier that hides in plain sight
Notice where the biggest silent leak sits. It is not the reply rate everyone obsesses over. It is the deliverability multiplier at the top. In the example above, moving deliverability from 85 percent to 65 percent, which is a completely ordinary decline for a domain sending to unverified lists, drops the model from 32 opportunities to 24. You lose a quarter of your pipeline and the reply rate on your dashboard never moves, because the emails that would have replied never arrived.
This is why the forecast has to treat deliverability as a measured input, not a constant. Verify the list before you send so you are not burning capacity on addresses that bounce and drag your domain reputation down; running a validation pass with a service like Scrubby protects the multiplier that sits in front of everything else in the model. A forecast built on a clean, deliverable list is a forecast you can trust. One built on a raw export is fiction with decimal points.
Capacity is a ceiling, not a dial
The most common mistake in outbound planning is treating sending volume as something you can turn up whenever the number needs to be bigger. You cannot. Every domain and inbox has a safe daily ceiling, and pushing past it does not add pipeline, it destroys deliverability and shrinks the multiplier that caps the whole model. If the bottoms-up math says you need 12,000 sends a month to hit the target and your infrastructure safely carries 8,000, the answer is more sending infrastructure with its own warmup runway, not more sends per inbox.
This is exactly the conversation the model is built to force. When capacity is the binding constraint, you either invest in more of it ahead of time or you reset the target. What you do not do is quietly overload the inboxes you have and watch the deliverability multiplier collapse. Standing up and warming that additional capacity is slow and operationally heavy, which is one of the reasons teams lean on an outsourced GTM partner like Vendisys that already runs the domain and inbox infrastructure at scale rather than building it from zero under a deadline.
Pressure-test the model before you commit to it
A forecast is only as good as the assumptions underneath it, so stress the weak ones before you sign up to the number. Three tests are worth running every time.
Run the pessimistic case. Rebuild the model with your worst plausible number for each input, not your average. If the pessimistic case still clears your minimum acceptable pipeline, the forecast is robust. If it falls apart the moment reply rate dips a point, you are one bad month from missing.
Isolate the ramp. New sending domains do not hit full safe volume on day one, and new reps do not book at tenured rates in week one. Model the ramp explicitly for the first sixty to ninety days instead of assuming steady state from the start, or your first-quarter number will run consistently hot.
Separate meetings booked from meetings held. No-shows are real and they sit between two steps of your model. If a fifth of booked meetings never happen, the opportunity number has to reflect it. Confirmed, well-run scheduling closes that gap; sending a proper calendar invite through a tool like Kali instead of a bare “does Tuesday work” reduces the no-show rate that otherwise silently deflates the back half of the forecast.
Turning the forecast into a weekly instrument
The model is not a document you build once and file. Its real value is as a live instrument. Because every input is measured, you can check actuals against the model each week and see exactly which multiplier is off. If pipeline is tracking low, the model tells you whether the problem is upstream (deliverability slipping, list quality decaying) or downstream (meetings booking but not qualifying), and those two problems have completely different fixes.
That diagnostic power is the whole point of building bottoms-up. A top-down target can only ever tell you that you are behind. A bottoms-up model tells you where and why, while there is still a quarter left to do something about it. Start from the five inputs, measure each one honestly, refuse to fudge the capacity ceiling, and the forecast stops being a number you hope to hit and becomes a system you can actually steer.