Open rate is vanity. Since Apple Mail Privacy Protection started pre-loading images, a large share of your “opens” are machines, not people. The metric that survived is reply rate, because a human has to read your email, decide it is worth a response, and type one. That makes reply rate the earliest honest signal that your outbound is working or wasting sends.
The problem is that almost no team knows whether their reply rate is good. A rep sees 3% and panics. Another sees 3% and celebrates. Both are guessing, because “good” depends entirely on your segment, your list quality, and how you count. This post gives you the 2026 benchmarks, shows you how to calculate the number correctly so you are comparing against the right bar, and walks through the levers that actually move it.
How to calculate reply rate correctly
Before you can benchmark, you have to measure the same way everyone else does. Most teams get this wrong in one of three ways.
Use delivered, not sent, as the denominator. If you send 1,000 emails and 120 bounce, you did not do outbound to 1,000 people. You reached 880. Reply rate is replies divided by delivered, not sent. Teams that divide by sent flatter themselves and hide a list-quality problem behind a bigger denominator.
Count unique human replies, not total replies. One prospect who fires back four messages in a thread is one reply, not four. And automated bounces, out-of-office notices, and unsubscribe confirmations are not replies at all. If your sequencing tool counts any inbound message as a reply, your dashboard is inflated by 20% to 40%.
Separate positive reply rate from total reply rate. Total reply rate includes “not interested,” “wrong person,” and “remove me.” Positive reply rate counts only responses that move toward a conversation. Both matter, but they answer different questions. Total reply rate tells you if your targeting and copy earn attention. Positive reply rate tells you if you earn interest. Report both or you will misdiagnose the problem.
The clean formula:
Total reply rate   = unique human replies / emails delivered
Positive reply rate = interested replies   / emails delivered
Get these two numbers first. Everything below assumes you are measuring this way.
The 2026 benchmarks by segment
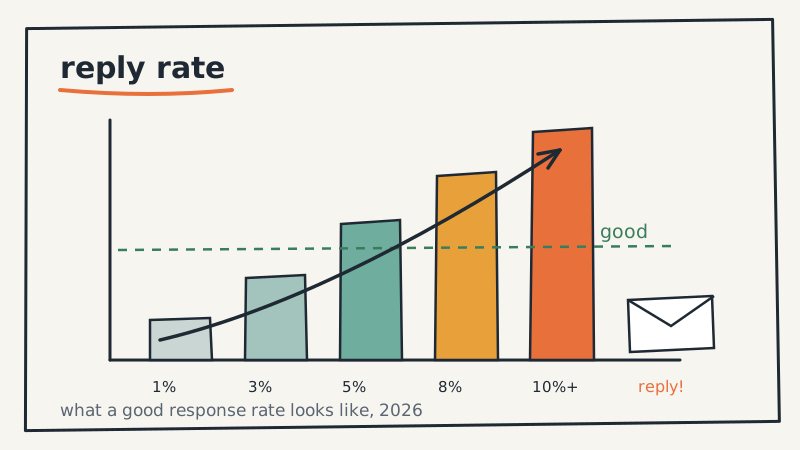
There is no single “good” reply rate, but there are defensible ranges. These reflect well-run outbound to a validated, reasonably targeted list in 2026. If your list is scraped and unverified, expect to land below every floor here.
Total reply rate (all inbound human responses):
- Below 1%: something is broken. Usually deliverability, targeting, or both.
- 1% to 3%: functional but unremarkable. Common for broad, lightly personalized sends.
- 3% to 6%: good. This is the target for most B2B programs with decent targeting.
- 6% to 10%: strong. Tight ICP, relevant trigger, and personalization working together.
- Above 10%: excellent, and usually only sustainable on small, high-fit segments.
Positive reply rate (interested only):
- Below 0.5%: the offer or targeting is off, even if total replies look fine.
- 0.5% to 1%: workable. Many programs run profitably here at volume.
- 1% to 2.5%: good. A healthy share of your attention is converting to interest.
- Above 2.5%: strong, and often a sign you have found a segment worth doubling down on.
Two adjustments matter. Segment size changes the ceiling. A 300-account list where every contact hits your exact ICP can sustain reply rates that a 30,000-contact blast never will. Deal size changes what “good” is worth. A 1.5% positive reply rate into enterprise accounts can outproduce a 4% rate into SMB, because each conversation is worth far more. Benchmark against your own segment, not a blended industry average.
Why most teams sit below the benchmark
If you are under the “good” range, the cause is almost always one of four things, in this order of frequency.
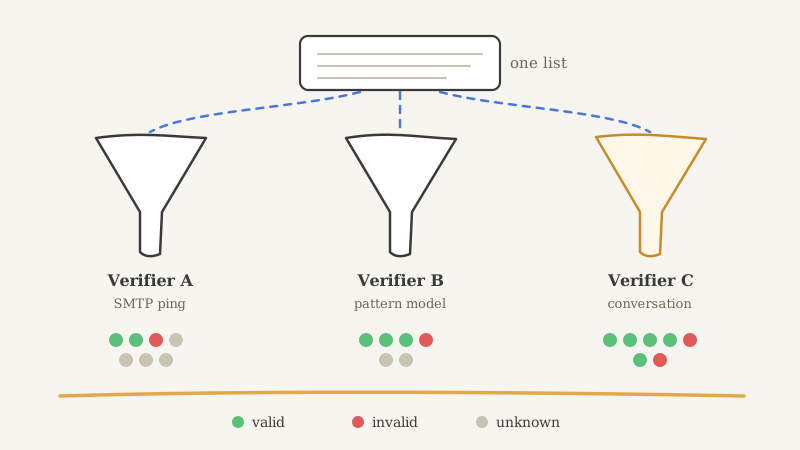
1. Deliverability, not copy. This is the silent killer. If a chunk of your email lands in spam, no one reads it, so no one replies, and your reply rate looks like a messaging problem when it is an inbox-placement problem. The tell: your reply rate quietly decays week over week even though nothing about your copy changed. Before you touch a single subject line, confirm you are actually landing in the inbox. Warm your domains, keep bounce rates low, and validate every address before it enters a sequence. Running your list through a verification pass with a tool like Scrubby removes the invalid and risky addresses that spike bounces and drag your sender reputation down, which is the fastest way to stop losing replies you never knew you were losing.
2. Targeting, not volume. A larger send to a looser list almost always underperforms a smaller send to a tighter one. If your reply rate drops as you scale, you are scaling into people who do not have the problem you solve. Narrow the list before you widen the funnel.
3. Relevance, not cleverness. The highest-replying cold emails are not the wittiest. They are the ones that reference a real, specific reason you reached out now: a trigger, a role change, a stated priority. Generic personalization (“I saw you work at [Company]”) does nothing. Reason-to-reach-out beats clever copy every time.
4. The ask, not the pitch. A first email that demands a 30-minute demo asks for too much from a stranger. A softer ask (“worth a quick look?”) lowers the cost of replying and lifts response rate, even if it adds a step before the meeting.
Notice that only one of these four is about the words in the email. Most reply-rate problems are upstream of copy.
The levers that move reply rate, ranked
If you want to raise the number, work in this order. The list is sorted by impact per hour of effort.
- Fix inbox placement. Validate the list, warm the domains, watch your bounce rate. This alone can double a reply rate that was being suppressed by spam foldering.
- Tighten the ICP. Cut the bottom third of your list by fit. Reply rate rises because the remaining contacts actually have the problem.
- Add a real trigger. Route sends around a signal (funding, hiring, a product launch, a competitor switch) so timing is on your side.
- Rewrite the first line around them, not you. Lead with their situation. Delete every sentence that starts with “We.”
- Soften the CTA. Replace the demo demand with a low-friction question.
- A/B test subject and length last. These help, but they are refinements, not fixes. Do them after the four above.
Most teams do this list backwards. They spend weeks A/B testing subject lines on a list that is half invalid and landing in spam. The copy was never the constraint.
When to stop optimizing and scale
Once your positive reply rate is stable inside the “good” band for a given segment, stop tuning that segment and start replicating it. Find the next lookalike segment, stand up fresh domains and inboxes for it, and run the same playbook. Reply rate optimization has diminishing returns; segment expansion does not. The teams that win at outbound are not the ones with the single highest reply rate. They are the ones who found a repeatable 4% and ran it across ten segments before their competitors finished tuning one.
That is also the point where the work shifts from creative to operational: managing dozens of domains, thousands of validated contacts, warmed inboxes, and the daily deliverability hygiene that keeps the whole thing landing. That operational load is exactly why a growing number of teams run outbound through a managed GTM infrastructure partner rather than rebuilding it in-house every quarter, and why AI-assisted sending layers like vsdr.ai are being paired with human review to keep personalization high while volume scales. The reply rate benchmarks in this post are the scoreboard; the infrastructure underneath is what keeps the number where you want it.
The one number to watch
If you track a single outbound metric weekly, track positive reply rate against delivered. It reacts fast, it is hard to fake, and it moves before pipeline does, which means it warns you early when something upstream breaks. Set your target from the benchmarks above based on your segment and deal size, measure it honestly, and treat any sustained dip as a deliverability alarm until proven otherwise. Do that, and reply rate stops being a number you guess about and becomes the earliest, most reliable read you have on whether your outbound is going to hit its pipeline goal.